Profiling Isaac Lab with Nsight Systems#
Isaac Lab supports CPU and GPU profiling via NVIDIA Nsight Systems (nsys) for runtime performance analysis. This can help identify GPU/CPU bottlenecks and determine the best configuration for your environments and tasks. Profiling adds modest runtime overhead and produces large output files, so it’s best suited to targeted investigations rather than long unattended training runs.
Common Use Cases#
My training iteration is slow - capture 3-5 iterations to see whether time is mostly spent on physics, rendering, env reset, observation, etc.
Env init takes 40 seconds - profile a single launch to see the import times for each module, kernel compilation, etc.
Which physics/renderer backend should I use? - profile your task with different backend combinations to find the best fit.
Are my GPU kernels efficient? - dive into the CUDA rows in nsys to identify when the GPU is idle (optimization opportunity).
Did my code changes make things slower? - A/B profile comparison before and after your change.
Quick Start#
This section walks you through everything needed to capture your first nsys profile.
Prerequisites#
Nsight Systems - install for your platform.
nvtxPython package for source code instrumentation, installed into your Isaac Lab environment:python -m pip install nvtx
Running a Profile#
The following command shows how to capture a profile for the Isaac-Cartpole task via the rsl_rl training framework with 3 iterations:
nsys profile \
    -t nvtx,cuda \
    --python-functions-trace=scripts/benchmarks/nsys_trace.json \
    -o my_profile \
    ./isaaclab.sh train --rl_library rsl_rl \
        --task=Isaac-Cartpole \
        --max_iterations=3
Flags:
-t nvtx,cuda- capture NVTX ranges (CPU swim-lanes) and CUDA activity (GPU row).--python-functions-trace=...- the function annotations file; ships with Isaac Lab.-o my_profile- output path; nsys appends.nsys-rep.
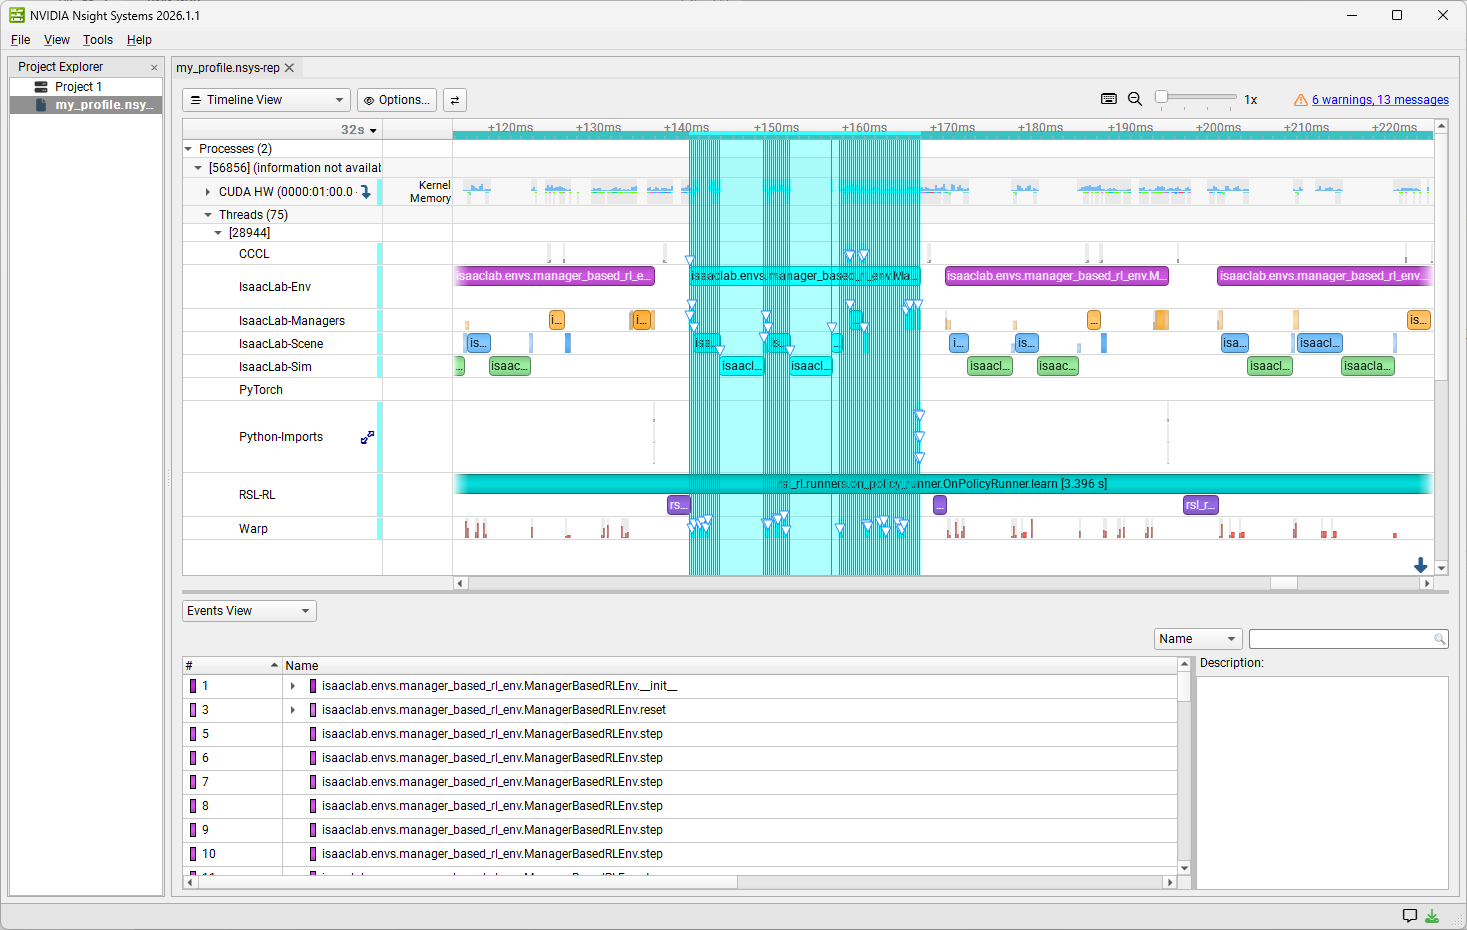
Reading the Resulting Profile#
Launch the Nsight Systems UI, go to File > Open, and select your .nsys-rep file that you generated in the previous step. Expand the Threads section and the domain swim-lanes will appear as separate rows. Clicking on a function will highlight related functions in other lanes. Expand the CUDA HW row to cross-reference with GPU kernels fired during that CPU range.
The Trace JSON#
The trace definition file lives at scripts/benchmarks/nsys_trace.json and defines metadata for the Python functions of interest in Isaac Lab. nsys monkey-patches these functions to automatically emit NVTX ranges at runtime.
Schema:
[
    {
        "domain": "MyDomain",
        "color": "0x9C27B0",
        "module": "isaaclab.envs.manager_based_env",
        "functions": [
            "ManagerBasedEnv.step",
            {"function": "ManagerBasedEnv.reset", "color": "0xAB47BC"}
        ]
    }
]
After editing the JSON, run the sync test to confirm every entry resolves:
python -m pytest scripts/benchmarks/test/test_nsys_trace.py
Troubleshooting#
An expected domain doesn’t appear in the timeline:
Confirm
nvtxis installed in your Isaac Lab environment (python -m pip show nvtx).Make sure the function is actually called during the profiled run.
Verify the JSON entry by running the sync test (above).
Sync test fails with an
AttributeError- a function listed in the JSON no longer exists at the given path.Fix the path to point at the renamed function, or
Remove the entry if the function was deleted.
See Also#
PhysX Simulation Performance and Tuning - broader simulation performance tuning tips.
Nsight Systems User Guide - official
nsysdocumentation.NVTX Python package - the package nsys uses to emit NVTX ranges from Python.